There are a million tools out there for monitoring services and measuring application performance, and I’m sure many of them are awesome.
When I went looking for a good service and infrastructure monitoring solution for our community newspaper’s one-person IT department (me), I came back to an open source tool that I’d probably first started using over 20 years ago: Nagios.
It works great for us and only costs $4/month to self-host. I thought I’d share about how we’re using it in case others might find it helpful.
My needs were pretty straightforward.
I wanted to monitor 10 or so servers and network devices and various services hosted on them, the health of 20 or so web applications, and the status pages of about 20 external services/platforms we depend on.
When something gets slow or stops responding, I wanted to know about it in a reliable way.
We’d used Nagios extensively at the website development and hosting business I ran a long time ago, and it was great for this kind of thing. Highly configurable and flexible, low maintenance, and very reliable.
When looking at options more recently, Nagios didn’t seem to have changed much in all that time, and with its outdated web interface and arcane config file syntax, I convinced myself that someone had surely created a better tool by now. So, I spent a bunch of time researching alternatives, including Zabbix, Prometheus, Grafana, Datadog, New Relic, Pingdom, UptimeRobot, and a bunch of others. And we did start out using UptimeRobot for a brief while.
But when I looked at the amount of time I was going to spend learning and managing the complexity of those stacks, or the amount of money we would spend on SaaS tools along with some of the constraints and “per seat” or “per monitor” limits they imposed, the more I was ready to go with a tried and true, purpose-built option that could scale up without additional cost or complexity.
Nagios is not fun to set up initially — see my earlier comment about arcane config syntax. It probably took me the equivalent of a full day to get everything just so. But once I did, it’s been humming along great, and brings significant peace of mind.
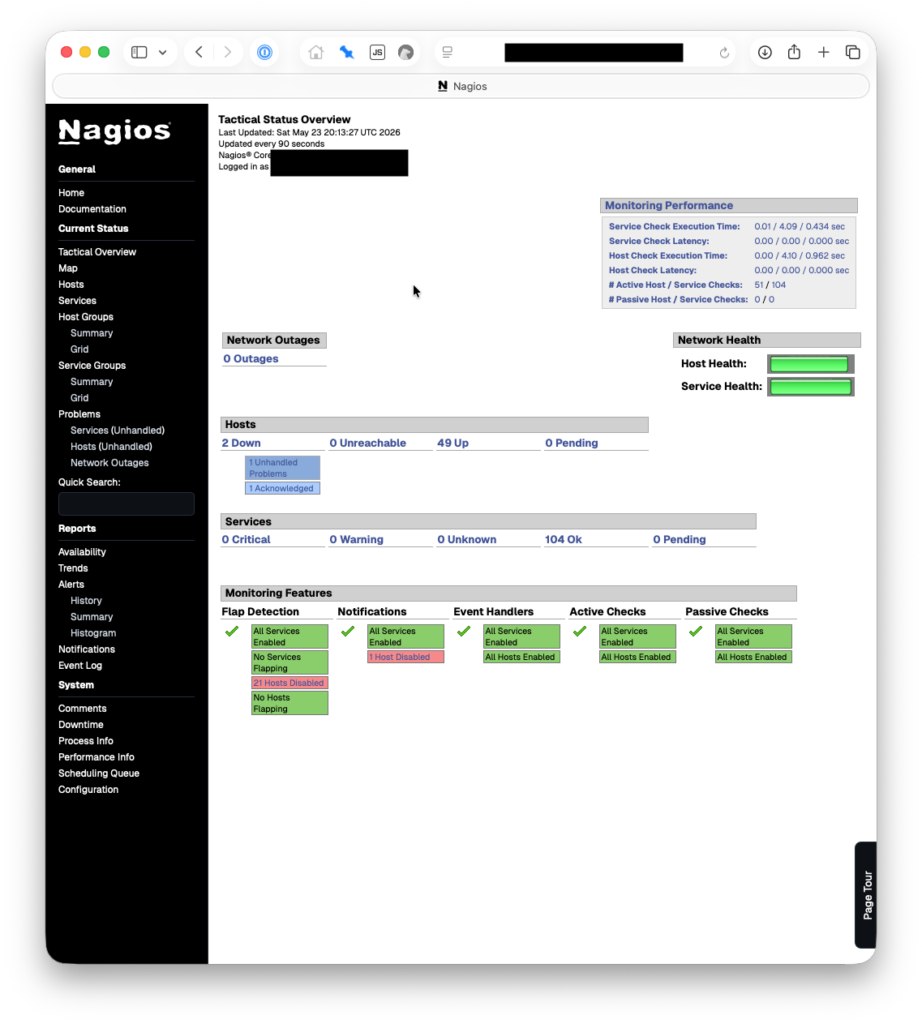
We’re currently monitoring 54 hosts and 104 services. This is all on a $4/month droplet at Digital Ocean, 1 vCPU, 512 MB RAM, 10 GB Disk. We pay another $0.80/month for weekly droplet snapshots. We set our monitoring droplet up in a different physical region from the rest of our servers/droplets, on the other side of the continent.
To get going, I started with these instructions from Edson Kimuli, which were very helpful. A few things I did during/after:
- Used a more modern PHP version
- Removed apache2
- Set up certbot for SSL usage
- Added a swap partition
- Installed and configured postfix for email sending, although I don’t think we’re really using it
- Installed Perl for using some Nagios plugins
- Locked down network access to the monitoring host
What we monitor
Here are some of the things we’re monitoring:
- That a given host is up via ping
- Web server is available
- Web server responds to a given request via Server Name Indication (SNI)
- SSL certificate for web server is valid and not about to expire
- DNS servers respond with the expected IP addresses for given hostnames
- Domain expiration is not imminent for critical domains
- Droplet disk space, load, and memory usage is as expected
- Server backups have successfully run recently
- SSH services are available and listening
- Web applications provide an expected response at a health endpoint
- Squid proxy server is running and accepting requests
- Proxy server serves up a PAC file with the expected contents
- Proxy server actually proxies requests, but doesn’t allow unauthenticated proxying
- Critical websites serve expected content at key pages, including their RSS feeds
- That our office networks are reachable from the public Internet
- VPN servers are accepting connections
For external status page monitoring, we basically check to make sure an “All Systems Operational” message is displayed according to whatever status page provider the SaaS tool we care about is using. This is a bit broad since many status pages display maintenance activities as an interruption to that all green status, but it works for now.
One thing I really like about Nagios is that if it doesn’t have a built in monitor for something, there’s probably a plugin for it, or I can build one myself with a simple shell script. I don’t have to install heavy third-party applications on every server just to have them participate in monitoring.
One random example is that Google’s status page doesn’t display a simple way to tell if all services are up and running — the “no incidents” indicator is a bit separate, so I wrote a simple if slightly brittle script to check how many of its services are listed as available:
#!/bin/bash

# Checks that the appropriate number of Google Workspace services are listed as available.

# URL to check
url="https://www.google.com/appsstatus/dashboard/"

# Run the command and store the output in a variable
output=$(curl -sSf "$url" | grep -oh 'psd__available'  | wc -l)

# Check if the output is equal to 33
if [ "$output" -eq 33 ]; then
    echo "OK - Expected output received: $output from $url"
    exit 0  # Nagios status code for OK
else
    echo "CRITICAL - Unexpected output received: $output from $url"
    exit 2  # Nagios status code for Critical
fi
Then in Nagios, you can set that script up as a “check command” that can be used to determine the health/status of a host you are monitoring:
define command {
    command_name    check-google-workspace
    command_line    /usr/local/nagios/plugins/check_google_workspace.sh
}
Even though this is a bit weird and requires occasional changes when Google adds or removes services, it’s one of those things that I think would be harder to do than I wanted with some SaaS tools.
We do also use the Nagios NRPE agent for a lightweight service check harness that allows me to then set up custom checks on a given server. If you use it, make sure you set up a firewall rule to restrict access from only your Nagios monitor.
Alerting
As an IT department of one, I need to make sure I don’t miss alerts, but I also don’t want to be overwhelmed by them.
So for now, I send all alerts to a dedicated Slack channel and important alerts to my mobile device using Pushover (another classic service that has been around forever and just works). Here’s the Pushover notification script we use. Alert payloads can be customized so that they do or don’t break through my “do not disturb” and sleep settings.
I also use the easyNag iOS app to be able to quickly review and act on alerts. Although I can get to the Nagios web interface quickly, I’ve found having a native app to quickly acknowledge an outage or review host/service status gives me the fast and modern ops feel I want when there’s too much to do.
Monitoring the monitor
What if Nagios goes down? It hasn’t happened for this installation yet, but just in case, I have a basic meta monitor in place using a free plan at Healthchecks.io. Nagios “checks” a Healthchecks.io endpoint every 5 minutes and if it hasn’t send a request within the expected window, Healthchecks.io will alert me via email, Slack and Pushover.
The relief of having good monitoring
To perhaps state the obvious, I’ve found that monitoring the status of all the systems and services we depend on brings reassurance and faster resolutions.
If there are mumblings spreading among my team about an outage, I usually already know about it and pinpointing the cause.
When one of our office location ISPs experiences a fiber cut, I’m usually the one to tell them about it, after convincing them that rebooting our router is not going to help.
And when I’m making configuration changes or upgrading something, it’s nice to know that many kinds of critical errors would be caught quickly.
If you aren’t monitoring your small business infrastructure, I highly recommend it.