There are a million tools out there for monitoring services and measuring application performance, and I’m sure many of them are awesome.
When I went looking for a good service and infrastructure monitoring solution for our community newspaper’s one-person IT department (me), I came back to an open source tool that I’d probably first started using over 20 years ago: Nagios.
It works great for us and only costs $4/month to self-host. I thought I’d share about how we’re using it in case others might find it helpful.
My needs were pretty straightforward.
I wanted to monitor 10 or so servers and network devices and various services hosted on them, the health of 20 or so web applications, and the status pages of about 20 external services/platforms we depend on.
When something gets slow or stops responding, I wanted to know about it in a reliable way.
We’d used Nagios extensively at the website development and hosting business I ran a long time ago, and it was great for this kind of thing. Highly configurable and flexible, low maintenance, and very reliable.
When looking at options more recently, Nagios didn’t seem to have changed much in all that time, and with its outdated web interface and arcane config file syntax, I convinced myself that someone had surely created a better tool by now. So, I spent a bunch of time researching alternatives, including Zabbix, Prometheus, Grafana, Datadog, New Relic, Pingdom, UptimeRobot, and a bunch of others. And we did start out using UptimeRobot for a brief while.
But when I looked at the amount of time I was going to spend learning and managing the complexity of those stacks, or the amount of money we would spend on SaaS tools along with some of the constraints and “per seat” or “per monitor” limits they imposed, the more I was ready to go with a tried and true, purpose-built option that could scale up without additional cost or complexity.
Nagios is not fun to set up initially — see my earlier comment about arcane config syntax. It probably took me the equivalent of a full day to get everything just so. But once I did, it’s been humming along great, and brings significant peace of mind.
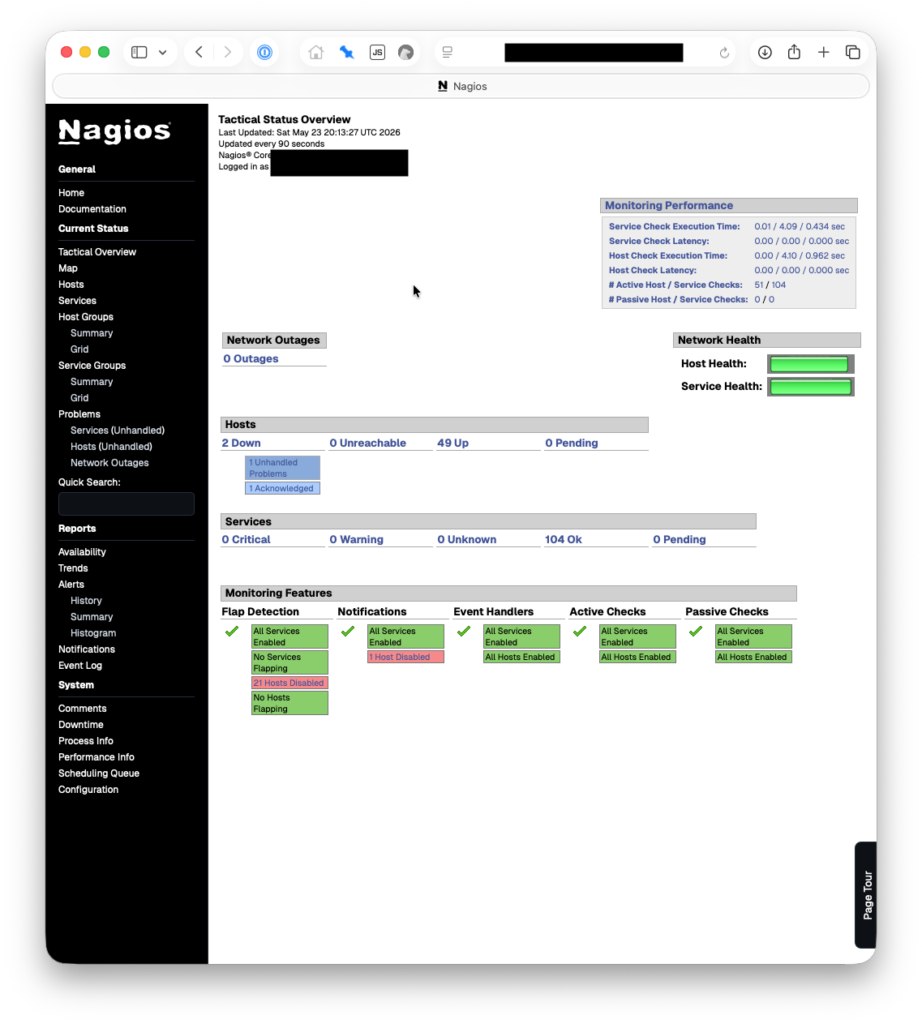
We’re currently monitoring 54 hosts and 104 services. This is all on a $4/month droplet at Digital Ocean, 1 vCPU, 512 MB RAM, 10 GB Disk. We pay another $0.80/month for weekly droplet snapshots. We set our monitoring droplet up in a different physical region from the rest of our servers/droplets, on the other side of the continent.
Continue reading Using Nagios for small business infrastructure monitoring