Let’s say your WordPress site has some set of custom functionality that is important to the overall operation of the site, and you want to know right away if it’s not working as expected, even if the site is otherwise “up” and working fine. There could be anywhere from 0 to many things needing attention at any given time, and you don’t want to receive a flood of emails or Slack pings that you have to sort through, you just want a single alert that things are off track, and another notice when they’re back to being in good shape.
I recently handled this case using transients, a custom REST API endpoint, and the service UptimeRobot. The context for me was a set of functions that regularly retrieve information from a variety of third-party sources; most of the time it goes fine, but between network issues, changes in third-party API endpoints or HTML source code and other possible errors, occasionally these functions would break and need updating.
First, I established an error function that was called any time some aspect of my site’s custom functionality encountered a problem that might need my attention.
public static function record_event_fetch_failure( $source = null, $message = null ) {

	if ( empty( $source ) ) {
		return false;
	}

	$source         = esc_attr( $source );
	$transient_name = 'event_fetch_failure_' . $source;

	$failure_data = array(
		'count'                => 1,
		'last_error_timestamp' => gmdate( 'Y-m-d H:i:sP', time() ),
		'last_error_message'   => esc_html( $message ),
	);

	// If the transient is already there, update it.
	$event_failure_counter = get_transient( $transient_name );
	if ( false !== $event_failure_counter ) {
		$failure_data['count'] = $event_failure_counter['count'] + 1;
	}
	set_transient( $transient_name, $failure_data, 24 * HOUR_IN_SECONDS );

}
When called, this function increases the counter of the number of errors interacting with a passed third party data source, storing that counter in a transient. As my custom functions run, any failures will be recorded for up to 24 hours. If there are no additional failures to increase the counter and extend the transient expiration time, then the failure data will go away with the assumption that things are back to normal now. (You may need to adjust these assumptions for your use case.)
Then, I create a REST API endpoint on the site that allows me to monitor that failure data externally.
add_action( 'rest_api_init', function() {
			register_rest_route(
				'mysite/v1',
				'/event_fetch_status',
				array(
					'methods'  => 'GET',
					'callback' => array( $this, 'mysite_event_fetch_status' ),
				)
			);
		} );
And then a callback function to determine the content of that API endpoint:
public static function mysite_event_fetch_status() {

	$error_count = 0;

	foreach ( array( 'facebook', 'eventbrite', 'googlecal' ) as $event_source ) {
		$fail_data = get_transient( 'event_fetch_failure_' . $event_source );
		if ( false !== $fail_data ) {
			$error_count += $fail_data['count'];
		}
	}

	if ( 0 < $error_count ) {
		echo sprintf( 'There have been %d recent event fetch errors.', (int) $error_count );
	} else {
		echo 'OK';
	}
}
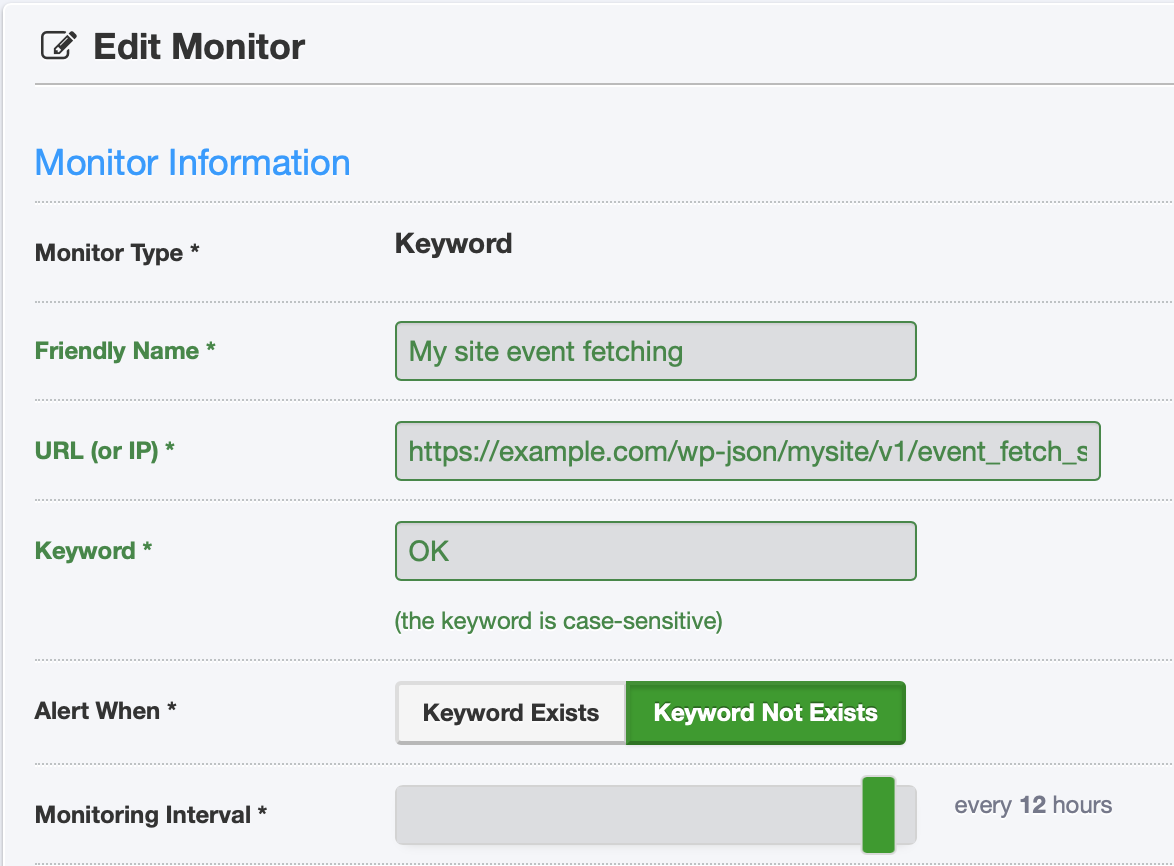
Now, I have a REST API endpoint available at https://example.com/wp-json/mysite/v1/event_fetch_status that will either return OK if there have been no recent problems, or an error message with a count of recent issues. I could expand that output to include more detail about which third-party services are having issues and what those issues are, but for the purposes of a red versus green monitoring setup, the basics are fine and I can look into the details when I investigate.
Finally, I set up a monitor in UptimeRobot to check that endpoint on a regular basis and notify me if there’s a problem:
Just for good measure, I also create an admin notice in the WordPress admin area with a little more detail about what is failing:
public static function mysite_event_fetch_admin_notice() {

	$error_count    = 0;
	$error_messages = array();

	foreach ( array( 'facebook', 'eventbrite', 'googlecal' ) as $event_source ) {
		$fail_data = get_transient( 'event_fetch_failure_' . $event_source );
		if ( false !== $fail_data ) {
			$error_count     += $fail_data['count'];
			$error_messages[] = $fail_data['last_error_timestamp'] . ': ' . $fail_data['last_error_message'];
		}
	}

	if ( 0 < $error_count ) {
		echo '<div class="notice notice-warning">';
		echo sprintf( '<p>There have been %d recent event fetch errors.</p>', (int) $error_count );
		echo '<ul>';
		foreach ( $error_messages as $message ) {
			echo sprintf( '<li>%s</li>', esc_html( $message ) );
		}
		echo '</ul>';
		echo '</div>';
	}
}

add_action( 'admin_notices', array( $this, 'mysite_event_fetch_admin_notice' ) );
All put together, I will now receive alerts as configured in UptimeRobot when my custom functions have issues.
You could go the typical route of generating an email or Slack message about each problem, but in my experience this can quickly create a lot of one-off monitoring and alerting configurations in your life, and that can lead to you missing important information or being desensitized to the notices. Instead, I find it’s worth trying to manage all of my time-sensitive notifications across all of my various projects and services in one place where possible, and UptimeRobot or similar services offer a lot of flexibility for that.